INTERSPEECH 2022 report
Language Model-Based Emotion Prediction Methods for Emotional Speech Synthesis Systems
institution: clova AI Japan
Abstract
This paper proposes an effective emotional text-to-speech (TTS) system with a pre-trained language model (LM)-based emotion prediction method.
- GPT-3: predict both an emotion class and its strength in representing emotions’ coarse and fine properties, respectively.
- emotional embedding space and used as conditional features of the TTS model for generating output speech signals
- produce emotional speech only from text without any auxiliary inputs.
- paragraph-level generation of emotional speech: GPT-3 enables to capture emotional context among the consecutive sentences.
Method
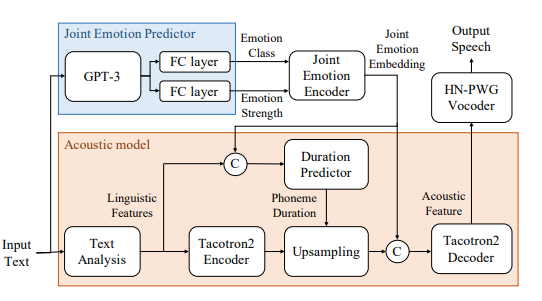
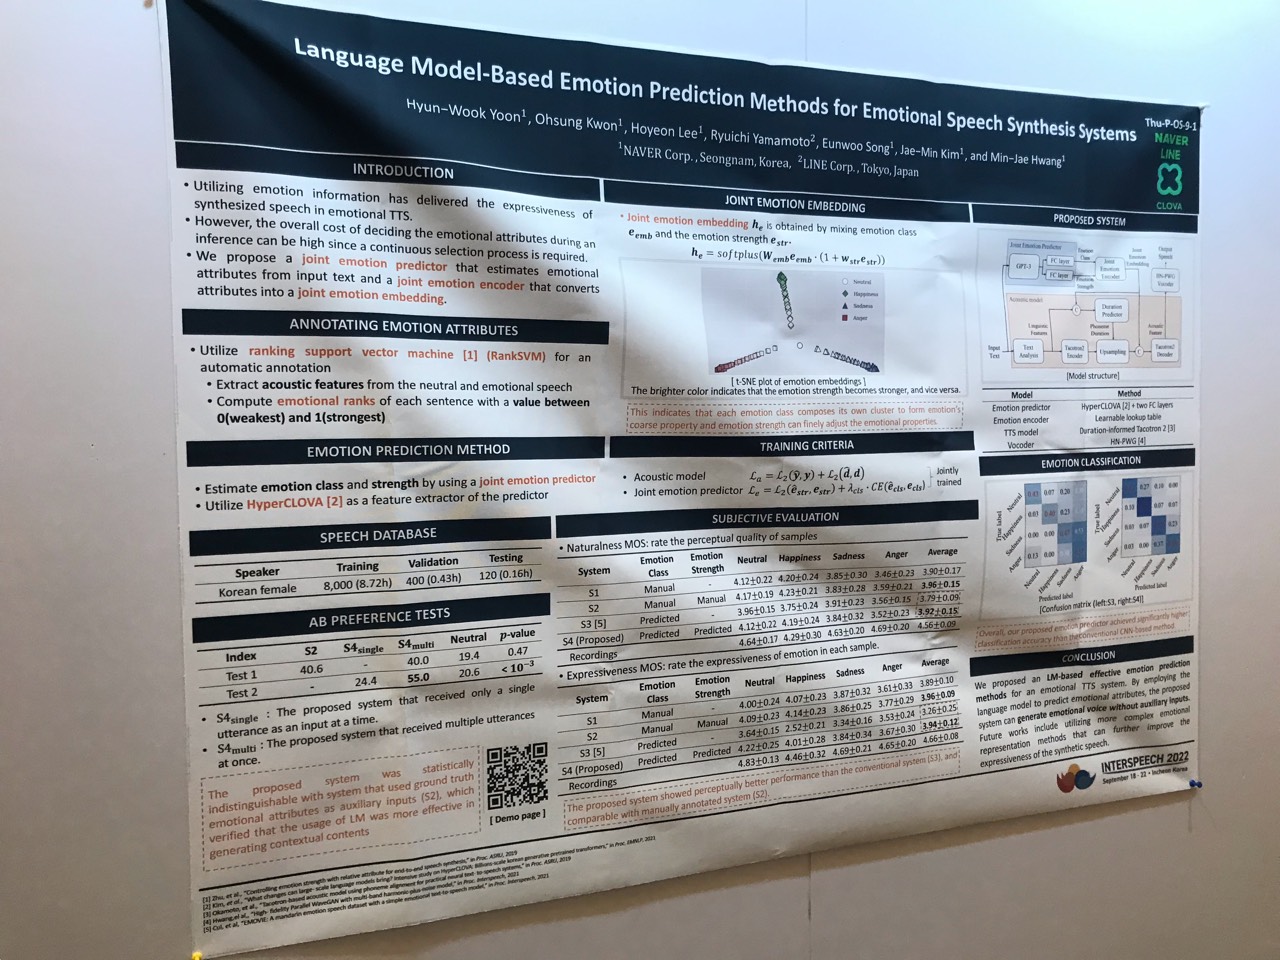
Figure 1: Block diagram of the proposed system; © denotes the concatenation process between input tensors.
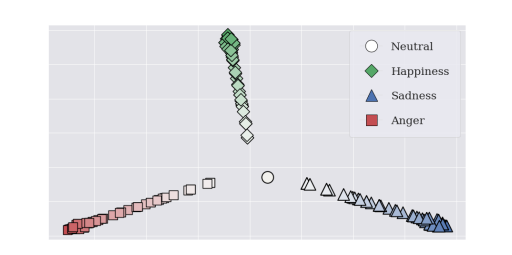
Figure 2: t-SNE plot of joint emotion embeddings generated from randomly sampled emotion strengths with various emotions. The brighter color indicates that the emotion strength becomes stronger, and vice versa.
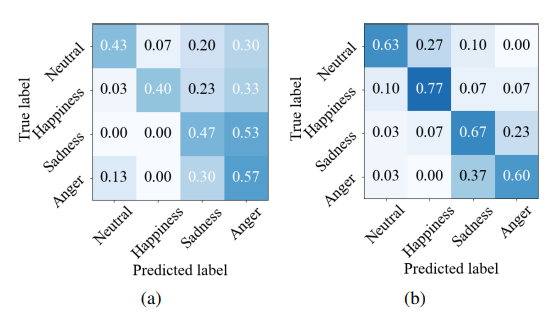
Figure 3: Classification accuracy of emotion predictors: (a) conventional CNN-based and (b) proposed LM-based methods
TTS-by-TTS 2: Data-Selective Augmentation for Neural Speech Synthesis Using Ranking Support Vector Machine with Variational Autoencoder
institution: clova AI Japan
Abstract
Our aim in this study is to selectively choose synthetic data that are beneficial to the training process.
- variational autoencoder (VAE): learning latent features: the recorded & synthetic corpora.
- train a ranking support vector machine (RankSVM): ranking relative attributes among binary classes.
- get a ranking features by RankSVM: determine how the synthesized speech is acoustically similar to the recorded data.
- selected from large-scale synthetic corpora: by using these data for retraining the TTS model
Method
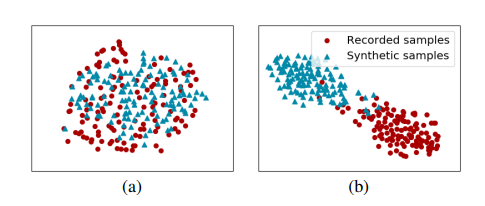
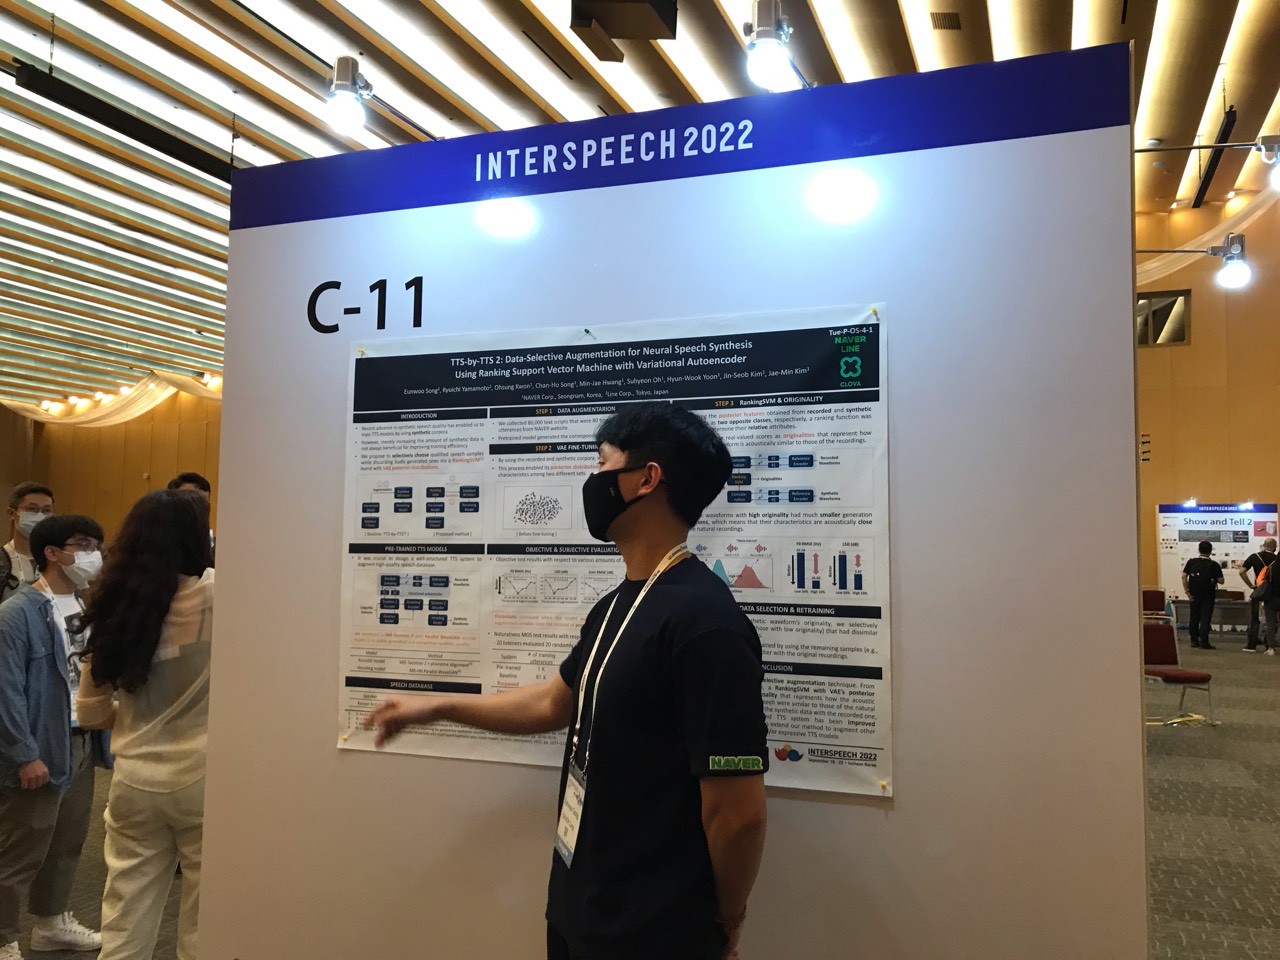
Figure 2: Distribution of the VAE’s posterior mean vector extracted from recorded (red dot) and synthetic (blue triangle) samples: (a) before and (b) after applying the VAE fine-tuning process.
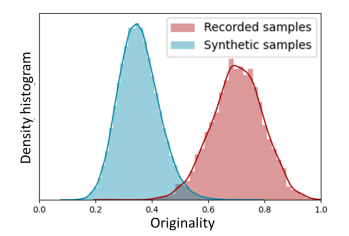
Figure 3: Density histograms of originality determined using RankSVM from the recorded (red boxes) and synthetic (blue boxes) waveforms, respectively.
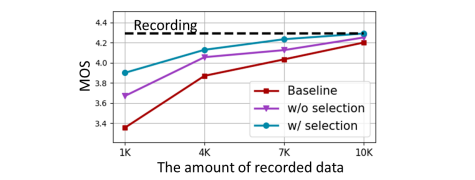
Figure 5: The MOS test results with respect to various amounts of recorded data: baseline model trained with recorded data alone (red square) and augmented models trained without (purple triangle) and with (blue dot) the proposed data selection method.
Probing phoneme, language and speaker information in unsupervised speech representations
institution: Meta, France
Abstract
- Unsupervised models of representations based on Contrastive Predictive Coding (CPC) are primarily used in spoken language modelling.
- We focus on three categories: phone class, gender and language, and compare monolingual and bilingual models.
Method
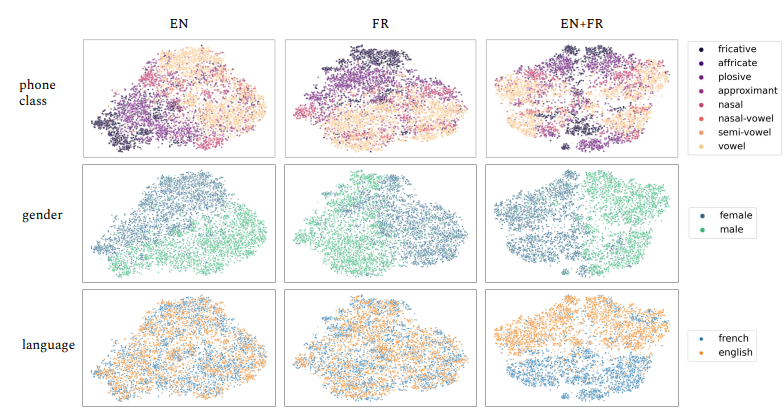
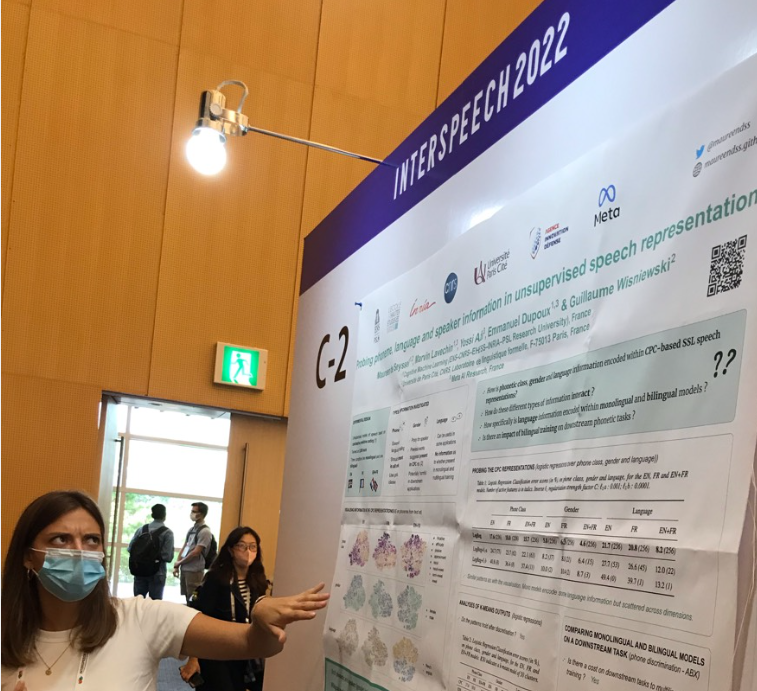
Figure 1: T-SNE visualisation of English and French phone embeddings at the CPC level, for monolingual (EN and FR) and bilingual (EN+FR) models. Embeddings are colored based on their phone class label, gender label and language label. fricative; affricate; plosive; approximant; nasal; nasal vowel; semi-vowel; vowel: 擦音;塞擦音;爆破音;近似值;鼻;鼻元音;半元音;元音
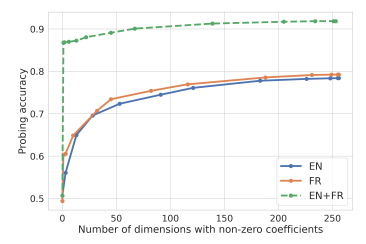
Figure 2: Probing Accuracy on Language Logistic Regression models wrt. number of active coefficients
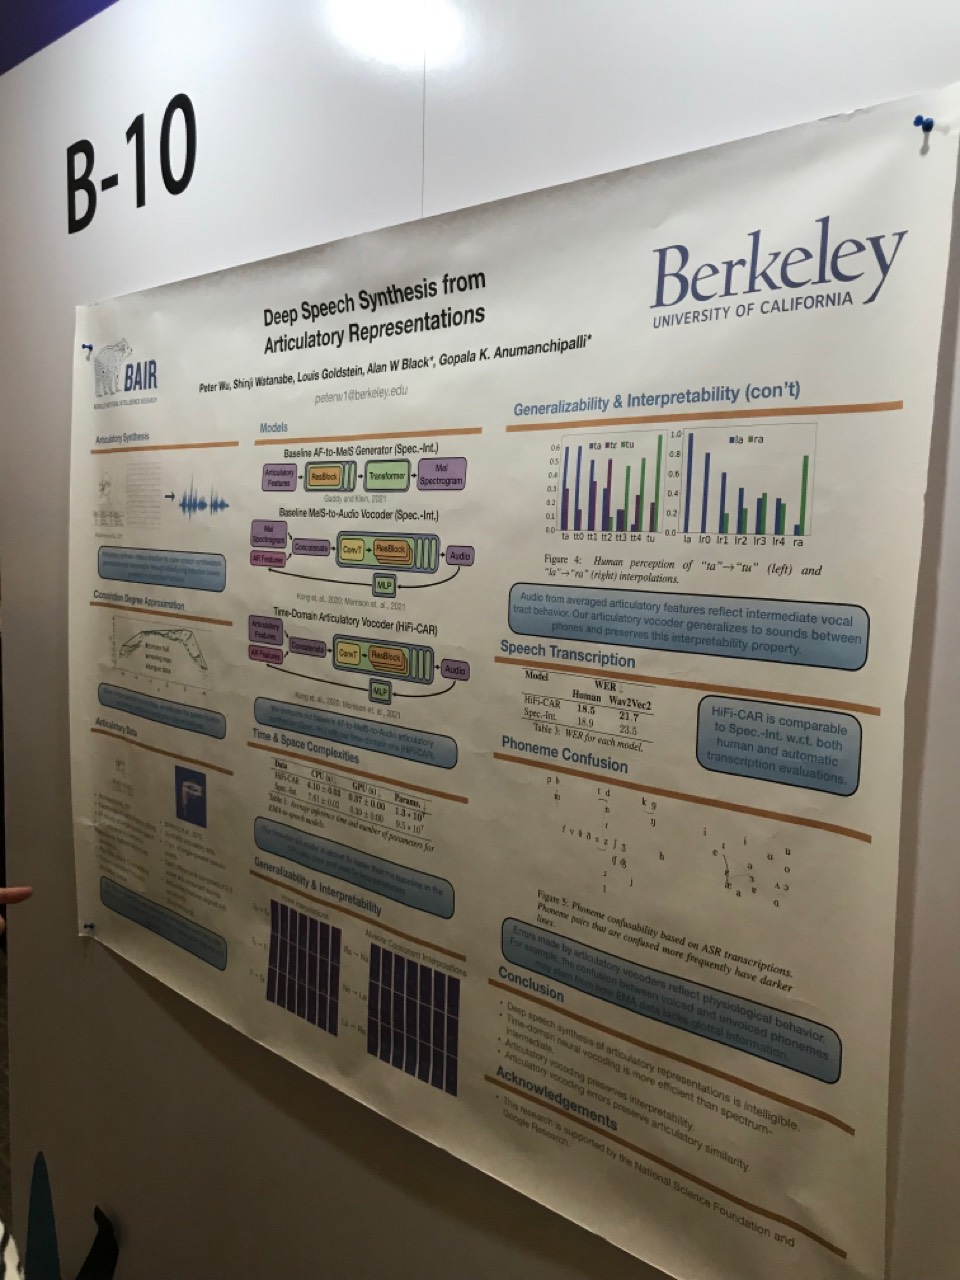
Deep Speech Synthesis from Articulatory Representations
institution: Berkeley
Abstract
- This task provides a promising direction for speech synthesis research, as the articulatory space is compact, smooth, and interpretable.
- we propose a time-domain articulatory synthesis methodology and demonstrate its efficacy with both electromagnetic articulography (EMA) and synthetic articulatory feature inputs.
Method
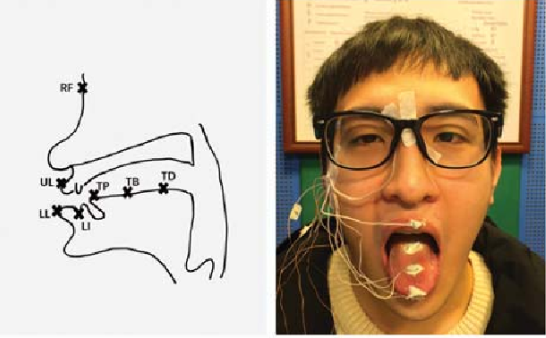
Electromagnetic Articulography (EMA)
Spectrum-Intermediate Baseline
- We map articulatory representations to spectrums using a six-layer Transformer prepended with three residual convolution blocks.
HiFi-CAR Model
- we feed our articulatory input features directly into HiFi-GAN.
- removing the need for an articulatory-to-spectrum architecture noticeably improves computational efficiency
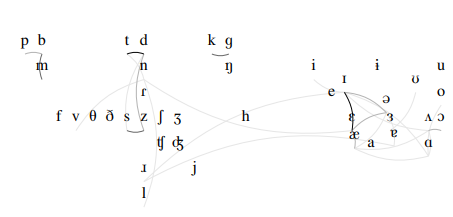
Figure 5: Phoneme confusability based on ASR transcriptions. Phoneme pairs that are confused more frequently have darker lines. Details in Section 8.
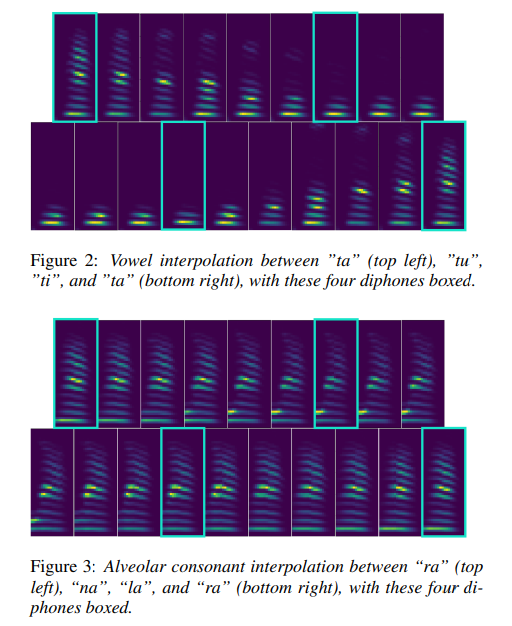
To study the generalizability of our time-domain model, we perform interpolation experiments, prompting our model to synthesize unseen articulatory representations between pairs of sounds.
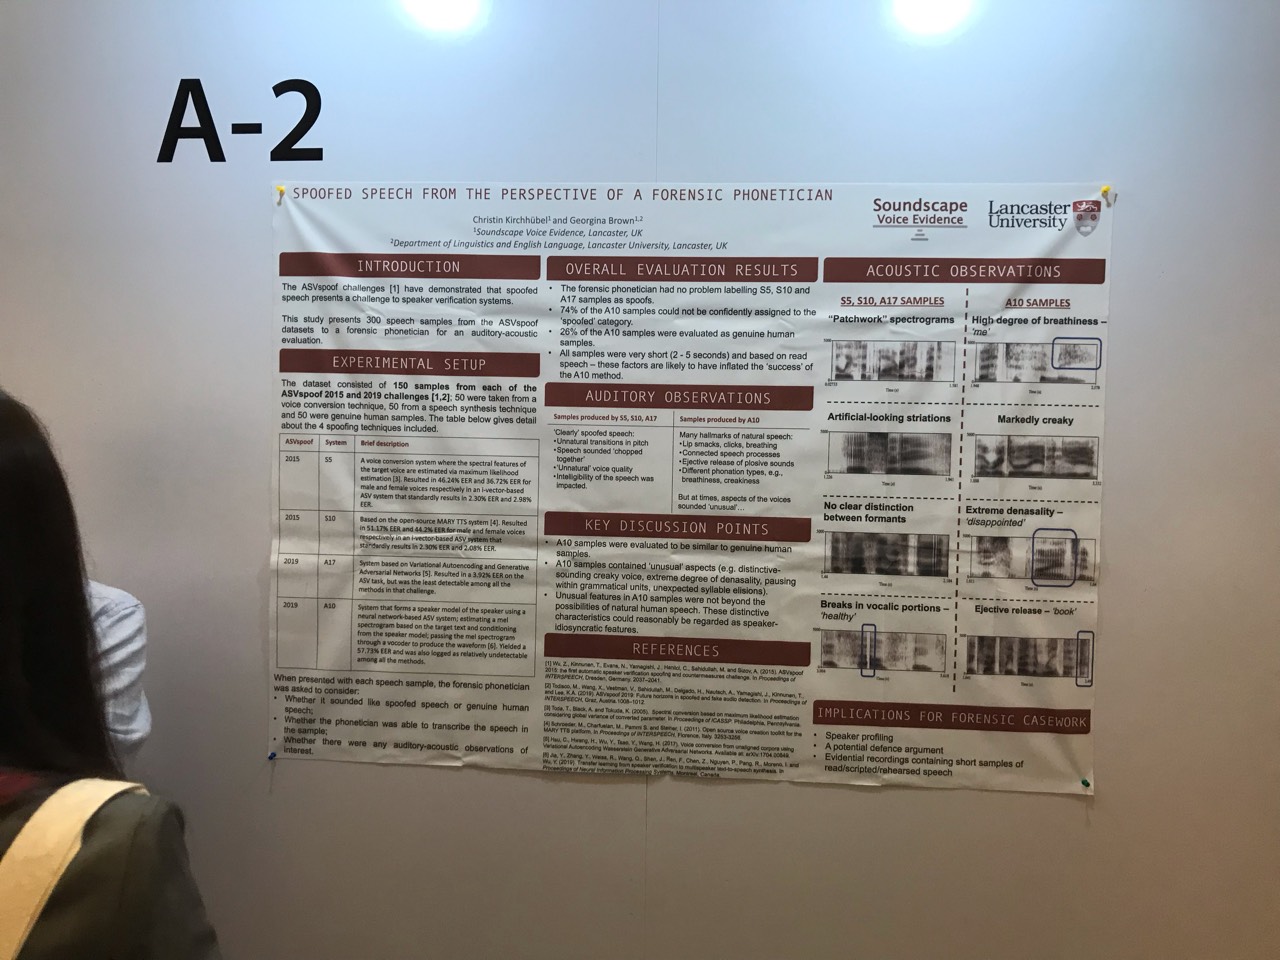
Spoofed speech from the perspective of a forensic phonetician
institution: Lancaster Universityphonetician.
Abstract
- This work looks deeper into these samples from the perspective of an experienced forensic (法醫學) phonetician.
- The main contribution of this paper is a descriptive account of different spoofed speech samples, based on the auditory-acoustic evaluation of a forensic phonetician.
- This is to spark an awareness of the current possibilities of spoofing methods that perhaps have so far been ‘off the radar’ for many forensic phoneticians.
Method
The phonetician was asked to offer insights on each of the 300 samples with respect to the following:
- whether the speech sample sounded like a spoofed sample or a genuine human sample;
- whether the phonetician was able to transcribe the speech contained in the sample;
- whether there were any auditory or acoustic observations of interest (in the form of qualitative notes).
observation
‘patchwork’ appearance as the result of a concatenative speech synthesis approach applied in the S10 method.
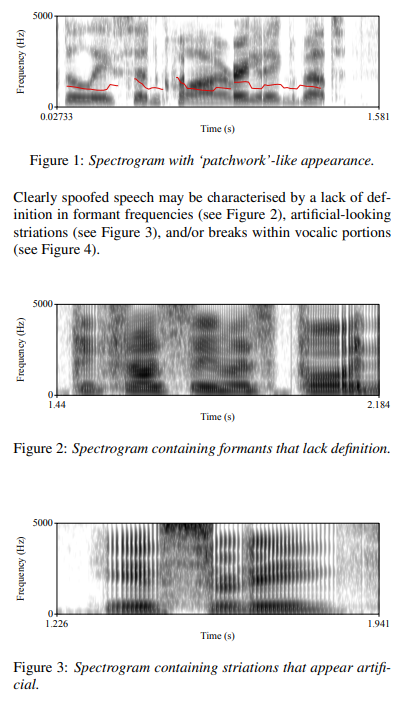 Clearly spoofed speech may be characterised by a lack of definition in formant frequencies (see Figure 2), artificial-looking striations (see Figure 3), and/or breaks within vocalic portions (see Figure 4)
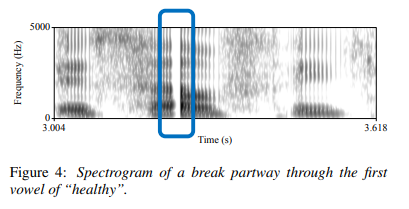 Figure 5 is an example spectrogram of the spoofed male speech “exactly by the rule book” with the highlighted section showing the ejective-release of the velar plosive
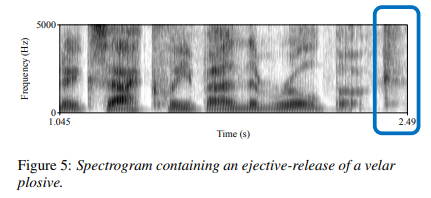 Figure 6 is an example spectrogram of the spoofed female speech “better for me” with the highlighted section displaying breathiness in the final vowel.
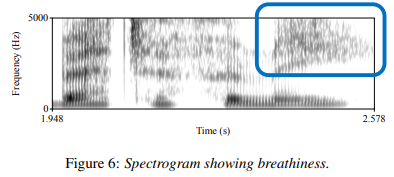 Figure 7 shows the spectrogram of the spoofed male speech “more regularly in the new year”; but it is difficult to conclude whether this is because the sample is spoofed or whether it is because the speaker has a distinctive voice.
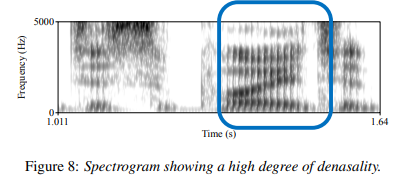
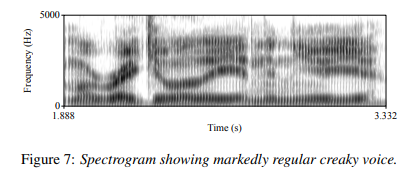 Figure 8 shows the spectrogram of the spoofed male speech “disappointed”; The degree of denasality is very unusual, but it is difficult to conclude whether this is because the sample is spoofed or whether it is a speaker-idiosyncratic marker.
